Show AI Trades
The trades of Holly will not only be presented to you in the AI Strategy Trades Window but also on the charts.
To enable this feature, right-click into your Chart, select Properties, and then Show AI Trades.
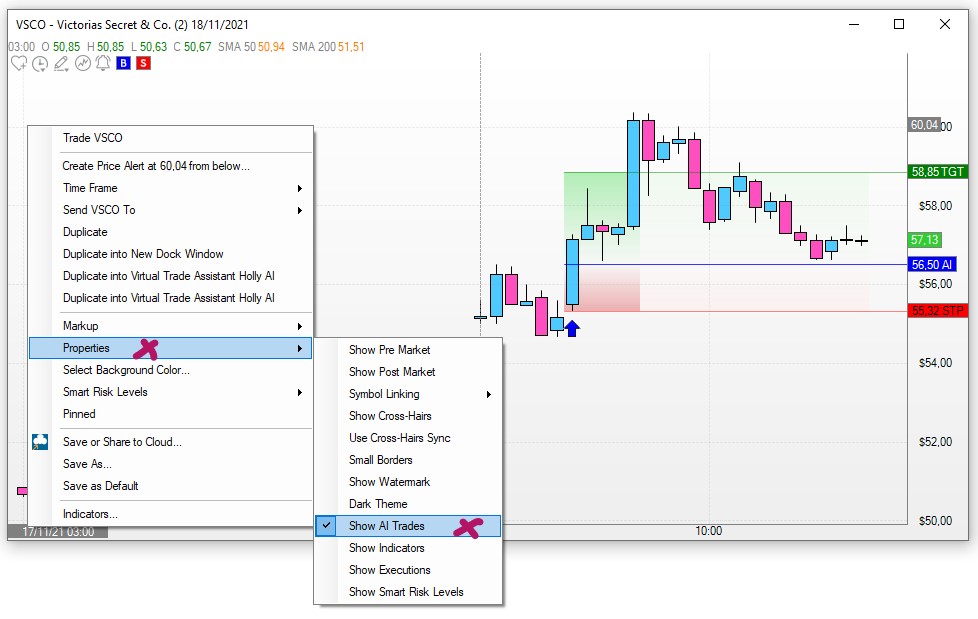
The AI trades will be displayed in a quick and easy-to-grasp visual format:
-
An upward-pointing arrow indicates the entry bar of a Long Trade.
-
A downward-pointing arrow indicates the entry bar of a Short Trade.
-
The blue line represents Holly's Entry Price.
-
The red line indicates the Stop Price.
-
The green line indicates the Target Price.
-
The background coloration highlights the time period of the trade.
-
The green coloration indicates the area in which the trade is profitable.
-
The red coloration points to the area in which the trade would result in a loss.
-
If you hover over the sideways-pointing arrows, you will see a breakdown of the trade parameters. This feature is particularly helpful when reviewing past Holly trades on the chart.
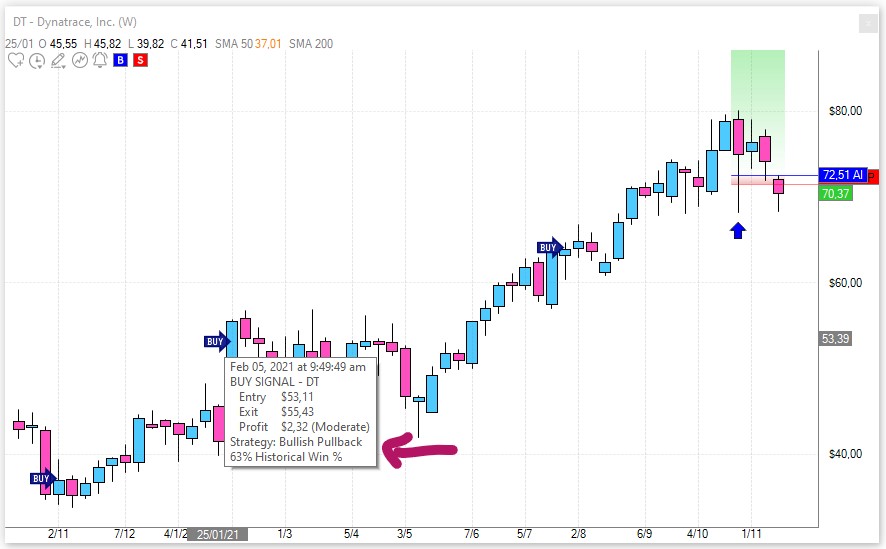
Holly Visuals on Charts: